Price Trends in Jabalpur Last 10 Years: 2016–2026 Real Estate Analysis
Introduction
Jabalpur’s property market has quietly transformed over the last decade. While metro cities saw sharp booms and corrections, Jabalpur followed a steadier path driven by end-users, infrastructure upgrades, defense-linked employment, education demand, and gradual urban expansion.
The story behind price trends in Jabalpur last 10 years is not about sudden spikes—it is about consistent value creation.
Key takeaway for 2026:
- Buyers who entered between 2016 and 2020 are sitting on healthy gains
- Premium localities outperformed city averages
- Peripheral growth corridors delivered stronger percentage returns
- Commercial assets generated better yields than residential
- 2026 remains a strategic entry point before the next growth cycle matures
This article breaks down the Jabalpur property price trends 2016-2026 with historical context and forward-looking lessons.
Jabalpur Real Estate Market: 2016–2026 at a Glance
Over the last ten years, Jabalpur moved from a slow-moving traditional market to a more organized Tier-2 city property destination.
Decade Snapshot
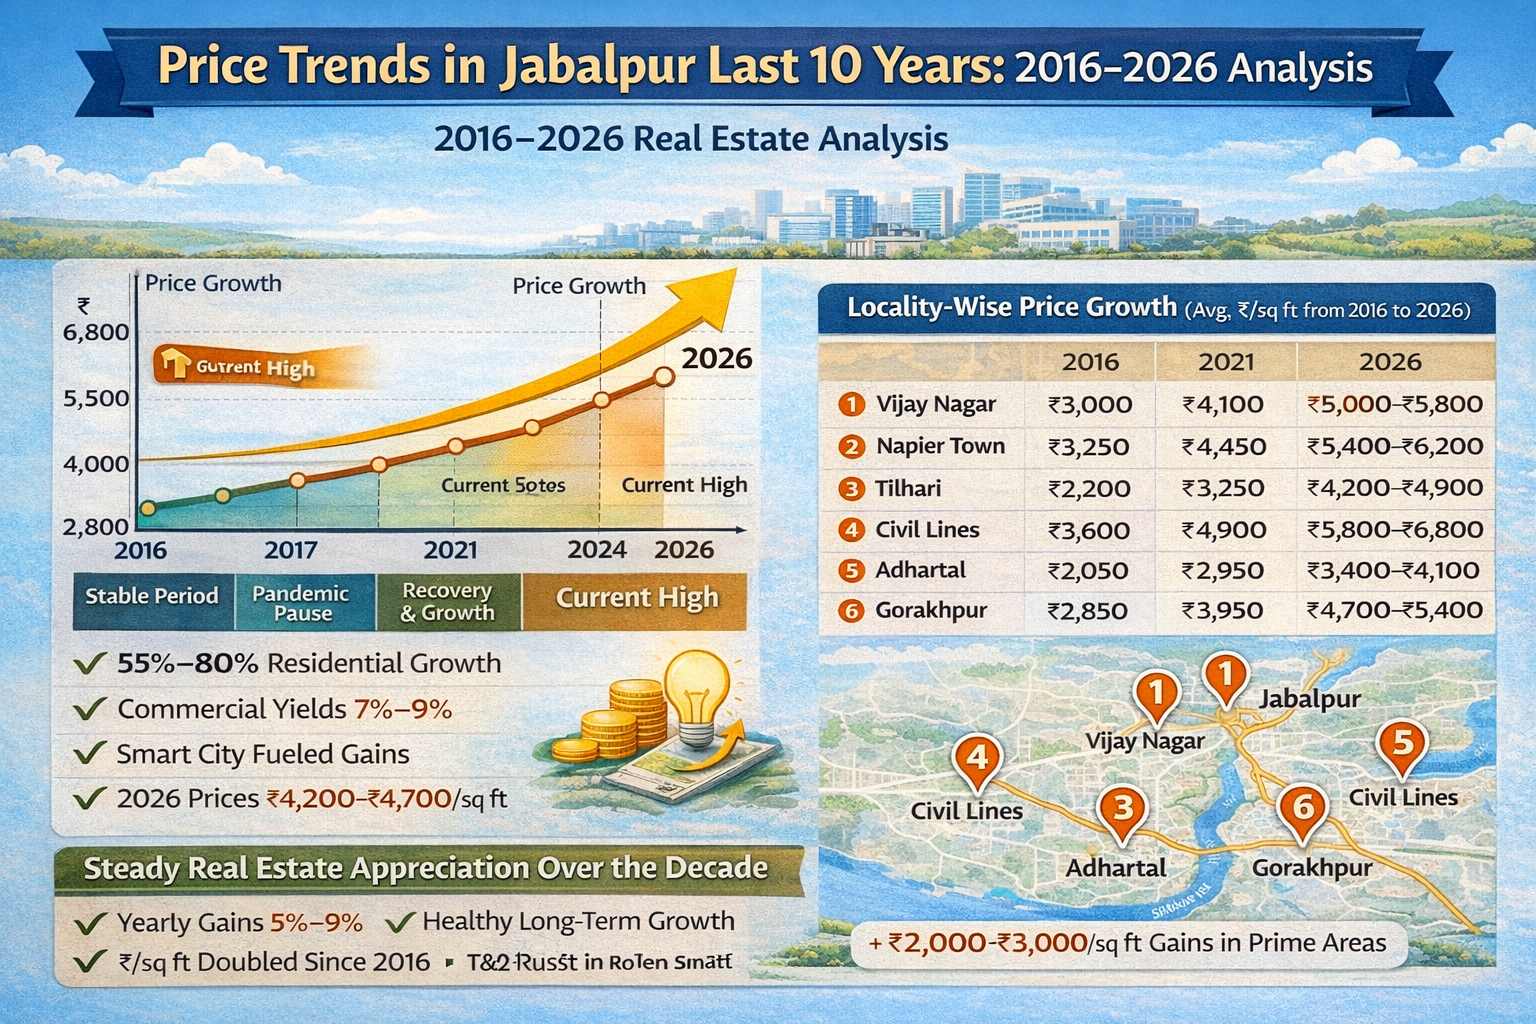
- Average residential rate in 2016: ₹2,450–₹2,800/sq ft
- Average residential rate in 2026: ₹4,200–₹4,700/sq ft
- Premium zones crossed ₹6,000/sq ft in 2026
- Residential appreciation over decade: 55%–80% depending on locality
- Commercial rents rose faster than sale prices in many pockets
- Post-2021 recovery accelerated momentum
This reflects healthy Jabalpur real estate appreciation last decade.
Year-by-Year Price Trends (2016 to 2026)
2016–2017: Stable Base Period
- City average around ₹2,500/sq ft
- Mostly end-user demand
- Low speculative activity
2018–2019: Gradual Rise
- Rates moved to ₹2,850–₹3,150/sq ft
- Better apartment launches
- Improved lending sentiment
2020: Pandemic Pause
- Growth slowed sharply
- Select distress deals available
- Prices largely flat, limited crash
2021–2022: Recovery Phase
- Demand revived after low rates
- Prices rose to ₹3,400–₹3,850/sq ft
- Larger homes gained popularity
2023–2024: Infrastructure Confidence
- Smart City works improved sentiment
- Rates crossed ₹4,000/sq ft
2025–2026: Expansion Phase
- Current average: ₹4,200–₹4,700/sq ft
- Premium micro-markets saw stronger gains
Residential Property Price Trends: A Decade of Growth
Housing remained the backbone of the city market.
Why Residential Stayed Strong
- Stable family demand
- Government, defense, education workforce
- Lower volatility than metros
- Affordable compared to Bhopal and Indore
10-Year Residential Growth
- Budget segment: 45%–60% rise
- Mid-market segment: 55%–75% rise
- Premium segment: 65%–85% rise
Current 2026 Snapshot
- 2BHK apartments: ₹32 lakh–₹55 lakh
- Premium 3BHK units: ₹60 lakh–₹1 crore+
This defines residential property rates Jabalpur 2026.
Commercial Property Price Trends: Steady vs Volatile Growth
Commercial property showed a different pattern.
What Happened Over 10 Years
- Retail roads appreciated steadily
- Small offices saw uneven demand
- COVID temporarily impacted shops
- Recovery after 2022 was strong
Typical Trends
- Prime commercial sale prices rose 50%–70% decade-wide
- Rental yields remained attractive at 7%–9% in prime areas
- Poor-location shops underperformed
Commercial rewarded location precision more than residential.
Locality-Wise Price Evolution (Top 6–7 key areas with 10-year data)
1. Vijay Nagar
- 2016: ₹3,000/sq ft
- 2021: ₹4,100
- 2026: ₹5,000–₹5,800
Strongest all-round performer.
2. Napier Town
- 2016: ₹3,250
- 2021: ₹4,450
- 2026: ₹5,400–₹6,200
Premium central market.
3. Tilhari
- 2016: ₹2,200
- 2021: ₹3,250
- 2026: ₹4,200–₹4,900
High-growth emerging corridor.
4. Civil Lines
- 2016: ₹3,600
- 2021: ₹4,900
- 2026: ₹5,800–₹6,800
Prestige-driven resilience.
5. Adhartal
- 2016: ₹2,050
- 2021: ₹2,950
- 2026: ₹3,400–₹4,100
Affordable growth zone.
6. Gorakhpur
- 2016: ₹2,850
- 2021: ₹3,950
- 2026: ₹4,700–₹5,400
Balanced demand locality.
7. Richhai
- 2016: ₹1,800
- 2021: ₹2,650
- 2026: ₹3,000–₹3,800
Strong percentage growth from low base.
Major Factors That Shaped Jabalpur’s Price Trends
Core Drivers Across the Decade
- Smart City infrastructure upgrades
- Better road connectivity and civic works
- Expansion of healthcare ecosystem
- Education migration from nearby towns
- Defense and public sector job stability
- Rising aspiration for modern housing
Post-2020 Accelerators
- Larger home demand
- Lower interest rates earlier in cycle
- Tier-2 city preference among buyers
These forces explain the Jabalpur housing market analysis 2016 to 2026.
How Jabalpur’s Price Growth Compares with Other Tier-2 Cities
1. Vs Indore
- Indore grew faster in headline numbers
- Jabalpur remained more affordable
2. Vs Bhopal
- Bhopal more mature pricing
- Jabalpur offered stronger catch-up potential
3. Vs Raipur
- Raipur more industrially driven
- Jabalpur more stable end-user market
Bottom Line
Jabalpur may not have delivered flashy spikes, but risk-adjusted returns were competitive.
Current Price Snapshot April 2026 & What the Data Reveals
Citywide Residential Bands
- Budget zones: ₹3,000–₹3,900/sq ft
- Mid-market zones: ₹4,000–₹5,000/sq ft
- Premium zones: ₹5,500–₹6,800/sq ft
What This Means
- Jabalpur is no longer a low-awareness market
- Yet it remains cheaper than many comparable cities
- Growth is becoming locality-specific
Investors now need micro-market selection, not broad city bets.
Lessons for Investors from the Last 10 Years
What Worked Best
- Buying in developing corridors early
- Holding for 5+ years
- Choosing connected localities
- Prioritizing quality construction
What Underperformed
- Isolated fringe inventory
- Weak-location commercial shops
- Overpriced luxury stock without demand
The decade proves patience beats speculation.
Future Implications Based on 10-Year Patterns
Historical data suggests the next phase may continue the same pattern.
Likely 2026–2030 Trends
- Prime zones may rise another 20%–30%
- Growth corridors may outperform on percentage basis
- Commercial rental demand to stay healthy
- Modern gated communities to attract premium buyers
- Plot demand to remain strong
Past patterns indicate infrastructure-led growth will continue.
Conclusion & Actionable Insights for Buyers and Investors
The price trends in Jabalpur last 10 years reveal a city that rewards disciplined, long-term investors rather than short-term speculators.


Leave a Reply